Of all sports that allow objective comparison, sport climbing has the smallest gap in performance between men and women
Overview:
Comparing the achievements of men and women in sports – we look at sports that allow an objective comparison. These sports include running, swimming, high-jump, long jump and others, where both men and women compete on the same grounds, with the same rules and where the score is free of human bias (like electronic finish-line timing for example). We then give each sport an index (a type of score) attesting to the asymmetry between female and male achievements. This score will then allow us to compare the inherent asymmetry between different sports.
Analyzing world record progressions from the past 100 years we find that of all the sports that allow such a comparison and have scoring data readily available, sport climbing has the lowest inherent asymmetry! Speed skating comes in at a close second whereas high-jump and long-jump had the highest asymmetry of all.
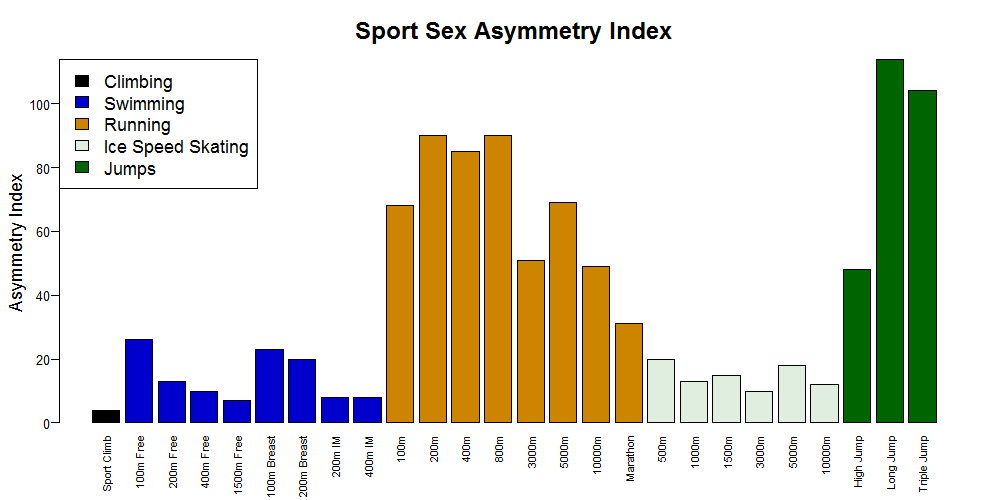
Before we go into the technical details, here is a plot of the asymmetry index (called SSAI, see below) for all the sports covered in this study. A higher index means more asymmetry between the achievements of men and women. Below the plot is a table summarizing the results.

 *Values with the ‘>’ sign (like >88) mean that that there is not enough data to know the exact index and that it is at least greater than some value (88 for example).
Introduction
First off I would like to state that the only reason this article compares men and women in sports is because the data for both are readily available and across many fields. The asymmetry index I'm about to present can be used to compare the achievements of any two groups like short and tall people or people with/without a sense of humor. If this offends anyone I sincerely apologize.
So – let us start by asking the following questions:
- In which sports can the achievement gaps between males and females be rigorously measured?
- Assuming the achievement gaps are measurable, how can we compare the gaps between different sports?
Comparing male and female achievements
Among sports where both men and women compete, surprisingly, there are few that allow for a rigorous comparison. An unequivocal comparison can be made if the following rules are met:
- Competitions are held for both men and women
- Competition rules for men and women are equal – run the same distance, lift the same type of weight, face the same challenges, etc.
- The score is given individually
- The score is free of human bias (any human taking the measurement would achieve the same score)
- The score is free of temporal bias (the rules of the sport do not vary too much over time)
- It’s obvious why the first rule is needed, if females and males do not both compete, they cannot be compared.
- Some sports fail the second rule: In Olympic discus, shot-put and javelin, men and women compete with objects of different weight and geometry. In Nordic skiing both men and women compete, but not over the same distances; in the Olympics, men do 50k and 15k whereas women do 30k and 10k. The rules for both sexes must be equal to allow a comparison.
- The third criterion rules out all team sports like basketball or volleyball. Though one cannot dispute the number of baskets in a game, still there is no absolute measure to the ‘goodness’ of a single player. Furthermore, male teams face other male teams whereas female teams face females. This violates rule 2) since they don’t face the same challenges.
- The fourth criterion is the most important and this is where most sports fail. I think most people will agree that women figure skaters are superior to male skaters, but how so and by how much – is hard to quantify. Sports such as figure skating, gymnastics and diving are scored by human judges according to execution, style, form etc. These criteria are not well defined and so each judge has a different scale by which he/she rates the performance. Also, the judges are not the same between two competitions, and so although the athletes in the same competition can be compared (more or less) to decide who the winner is, it will be hard to compare scores between competitions, even those given for the same routine.
- The fifth rule means that the way the sport is played does not change over time. This rule is not necessary to allow comparison between men and women at a given time, but is essential for comparing the results of athletes today with those of athletes in past years. It will soon become apparent why this is needed.
Some sports which pass all the criteria above are for example: running, swimming, long-jump, high-jump, ice speed skating and sport climbing.
Finding a way to compare
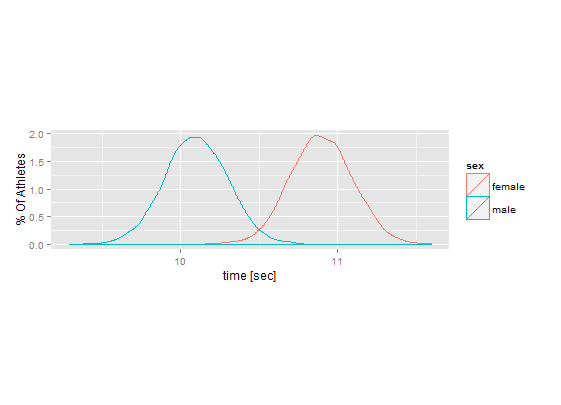
An obvious way to generate an asymmetry index is to look at the bulk of results from a certain year for men and women and compare them. Take the 100m dash for example: we can gather up all the results from all the heats of all competitions, both national and international held in 2014. Plotting the results will probably look something like this:
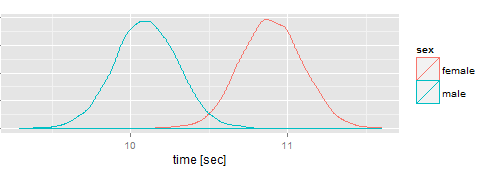
The amount of overlap is a measure of asymmetry – the smaller the overlap, the higher the asymmetry. For example, we can sort all the results and ask what percentage of male results are found before the first female result. This type of index is very good theoretically, but it has two major drawbacks:
1) This index is practically impossible to calculate. For all but the most symmetric of sports you would need thousands of male scores before you reach the first female one. This amount of scores means you need the results to every heat in every international and national event. This data is very difficult to collect, if it is available at all. Furthermore, if you want to compute this index for past years – data is even harder to obtain.
2) Since results are needed from events other than the major ones (Olympics, world championships), some of the results may not be standardized: races may not be digitally timed, tracks may vary and key factors like wind speed may not have been taken into account. Comparing results then becomes hard if not impossible.
So, given the data available on the net, how can one still give some approximation to the asymmetry in a sport?
The Sport Sex Asymmetry Index (or SSAI)
Here we describe an index – a measure of how asymmetric a sport is. This index is built to allow comparison between different sports, even those with vastly different rules and scoring systems. What’s more, this index only needs world-record progression tables, such that are common on the net for many sports.
Definition 1:
For a certain sport, assume that men have a better world record than women at time Τ. SSAI at Τ measures the number of years we need to travel into the future from Τ to first encounter a women athlete whose world record matches the male world record at Τ.
For example, in 100m freestyle the men WR in 1968 was 52.2 seconds. This was first surpassed by women in 2009 with 52:07 seconds. Therefore, the SSAI for 100m freestyle in 1968 was 41, since the men WR at the time was bested by women 41 years later. The smaller the index, the less asymmetric a sport is at a certain point in time.
Here are some attributes of SSAI:
- Though it is defined for all years, it can only be (yet) computed for all past years. For example, in the 100m freestyle, it can only be computed for the year 1968 and earlier since women have yet to beat male records made after 1968.
- Most likely SSAI will become infinite from a certain point in time. To explain this let’s consider the 100m dash: No one knows what the human limit is, but since no man or woman will ever run the 100m dash in 2 seconds, the limit exists and lies somewhere between 2 and 9:58. Let us assume the limit of one group (either men or women) is just slightly better that the limit of the other group. Just for the sake of discussion, let us assume that the limit of men is slightly faster than that of women (though it does not have to be) and let’s write the best possible time for women as tf_max. Since we assume the male limit time is slightly shorter, there will come a time when the best males have gone under tf_max and at this date, though no one will know it, the index will have become infinite, since no matter how far into the future we travel, we will not be able to bring back a woman sprinter capable of winning the race.
Since the SSAI will vary over time, and since we are looking for a time-invariant measure to the sex asymmetry in a sport, let us look at the minimal value the SSAI has attained over the years as a proxy to the overall asymmetry in the sport:
Definition 2:
The SSAI for a sport is the minimal SSAI over all the years that it can be computed.
So, having defined that, how do different sports compare? Which sports are the most asymmetric? Which are the most symmetric?
Data Plots
Let’s take a look at the SSAI as a function of time for several sports which pass all the criteria above. The following plots show SSAI as a function of time for years where it can be computed – years when world records were set by men, records that were later surpassed by women at some point in time.
Freestyle Swimming
In freestyle we see the minimum attained somewhere in the mid 1960’s and the index pretty much rising ever since.

The Minimal SSAI are shown in the table below:

This trend is consistent with the claim that men are superior over short distances where power plays a major part and that this peters out over long distances, where endurance comes into play.
Breaststroke Swimming
In breaststroke and individual-medley the picture is similar with the SSAI currently on the rise:
The Minimal SSAI:

Running
Let’s look at some running events – here the results look a little different: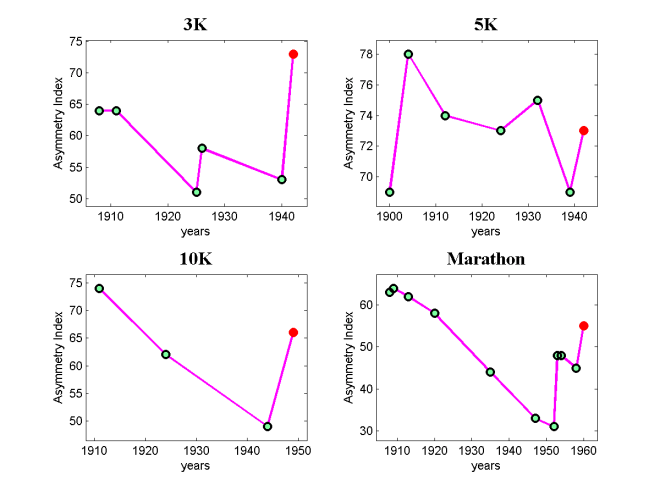
Though the SSAI tends to be much larger here, it seems to be on the decline, or at least it was in the 1940’s when we can last compute it. This seems comparable with the SSAI plots from swimming in the same years more or less.
The Minimal SSAI:

Again, the long distances bring a lower SSAI, and the minimal SSAI for these events may not have been reached yet. The drop at the last measurable points (green) of the Marathon SSAI is due to the amazing Paula Radcliffe
So apart from running and swimming – which other sports can be compared with SSAI?
Speed Skating
Speed skating is such a case and very interesting to look at. Though competing for pure speed on distances similar to running, SSAI are remarkably lower here:
What makes this sport so much more symmetric than running? Even over short distances, asymmetry is minimal. Is it that different muscle groups are at work? Is it that technique plays a larger part in attaining speeds? I really don’t know.
It’s worth mentioning that body suits and Klap skates have made a big difference in modern skating and this may contribute to the current day low SSAI. Also the move from natural to artificial ice around 1960 made a difference.
What makes this sport so much more symmetric than running? Even over short distances, asymmetry is very small. Is it that different muscle groups are at work? Is it that technique plays a larger part in attaining speeds? In any case the Minimal SSAIs for this sport are impressive:

So, can we find a sport with a lower minimal SSAI than 7 (for 1500m freestyle)?
Sport Climbing
The answer is yes! Looking at the new and exciting field of rock climbing, Sport Climbing stands out as being highly symmetrical, with men and women climbing almost as hard:
Since climbing is close to my heart and since the route grade is not something everybody if familiar with, I’ve added the table according to which the SSAIs were calculated.
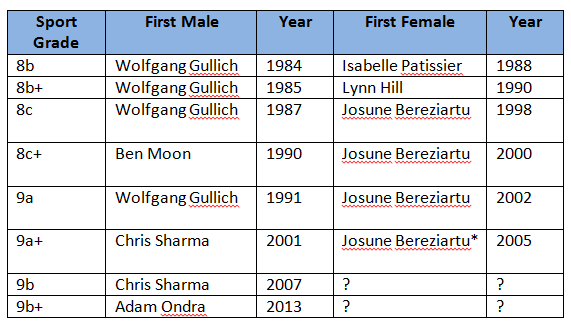
*The 9a+ route Josune sent (climbing jargon for 'climbed without falling') is now rated 9a/9a+ and there has yet to be another female 9a+.
This sport harbors the smallest SSAI yet of 4!
Though no women today climb 9b or 9b+ there are, however, some very promising (and hideously strong) young girls that I am sure will reach this mark.
Note that though competitions are held in sport climbing, the competition results cannot be used to compare men and women; the routes in each competition are different – built with plastic holds on artificial climbing walls. Moreover, men and women usually do not compete on the same routes. The competition results therefore, unlike all the other sports discussed – cannot be compared. The index uses only outdoor rock routes, which usually change little over time, and see ascents by men and women alike.
A technical note on the plots:
The last point in the plots is colored red and represents a hypothetical SSAI that would be obtained if right now (2015) women were to reach a WR that would match the next male WR after the year where SSAI was last measured.
That was a little cryptic so let me explain…
For example, in 100m freestyle, current women WR is 52:07 recorded in 2009. This is closest to the men WR of 52:6 from 1968, giving the year 1968 a SSAI of 2009-1968=41. The next male WR progression after 1968 happened in 1970 with a drop to 51:94. We don’t know when women will go below 51:94 and the more time it takes, the higher the SSAI for 1970 will be. However, we can get an idea of the current trend by assuming that it will happen this year, giving 1970 a SSAI of 2015-1970=45.
This assumption is tricky since on the one hand, women may take a decade longer to reach 51:94 giving 1970 a SSAI of 2025-1970=55. However, they may also drastically improve the WR this year to 49:36 – the men WR from 1986! In this case the SSAI for 1986 will become 2015-1986=29, resulting in a SSAI of 39.6667 for 1970 by interpolating between the two points (1968,41) and (1986,29). Since we can’t be sure, this last point is colored differently.
Discussion
So what is it about sport climbing that makes it so symmetrical? I would guess that some of the things that men tend to better at than women, like absolute strength and explosive power, play a relatively minor role in achieving high grade climbing, whereas flexibility and agility, which women are usually better at, are key to making those tricky moves. Climbing is also highly dependent on mental skills that are not sex-dependent, like overcoming fear, planning ahead and general problem solving. Physical attributes needed like muscle endurance and finger strength are also fairly equal between the sexes.
What can SSAI tell us about a sport? Well, for one, it can point out which sports are approaching maturity – that is, people are already performing close to the human limit – sports such as Long Jump, High Jump and Triple Jump for example. All these share a high SSAI, but it’s not only woman which are having a hard time catching up to the men, it’s also the men that are having a hard time: In the long jump, Bob Beamon’s 8.90m waited from 1968 to 1991 to be broken with 8.95 and that record still stands. In the high jump, Javier Sotomayor’s 2.45m achievement from 1993 is still waiting for someone to break it and in the triple jump Jonathan Edwards’ 18.29m from 1995 still reigns.
Sports Not Included
You may wonder why some sports which should have passed all criteria set above are not mentioned here? Here is a list of such sports and why they were not included.
Long Jump, Triple Jump – not enough data to compute the index. For example, in the Long Jump, the woman WR today of 7.52m is lower than the first recognized men WR of 7.61 from 1901.
Equestrian – The horses have no doubt improved greatly, but I can't be certain about the riders. In any case I don’t consider this a sport.
Another problem of comparing sports over the years is that the scores of the same sport need to be comparable (rule 5 above). Changes in rules and equipment make this comparison difficult and rule out such sports as archery (too many rule and equipment changes), cycling (equipment changes here are critical).
It’s true that equipment changes affect all sports, like new hi-tech tracks and shoes for running and fast pools and hydrodynamic swimsuits for swimming. This is true and may contribute to underestimation of the index at times.
However, I believe that in some sports, such as cycling, the improvement has been so drastic that comparison with past scores is irrelevant. I can’t say where I draw the line, but cycling is on the wrong side of it. They also wear funny helmets.
Shooting – too many rules were changed and even today, women do not participate in some events.
Did you know that in the 1900 Paris Olympics, live pigeons were used as targets? They were sitting ducks…
Long Walks – the way they move freaks me out, and also, it's so unnatural; if people want to move fast, they run! I therefore did not include Long Walks on account of low aesthetic appeal and efficacy.
Data processing:
Data was taken from Wikipedia WR progression tables such as this one: http://en.wikipedia.org/wiki/Marathon_world_record_progression, except from speed skating records that were taken from http://www.speedskatingstats.com/index.php?file=records
If there were several WR for the same year, the best one was taken to represent the WR for that year. All table parsing and data processing was done in Matlab. Plotting was done in Matlab and R.
Oren Ish-Am
January 2015


